


Power BI Update September 2018
This September, Microsoft has again expanded the scope of its “Power BI” product with exciting and often requested features that developers can look forward to.
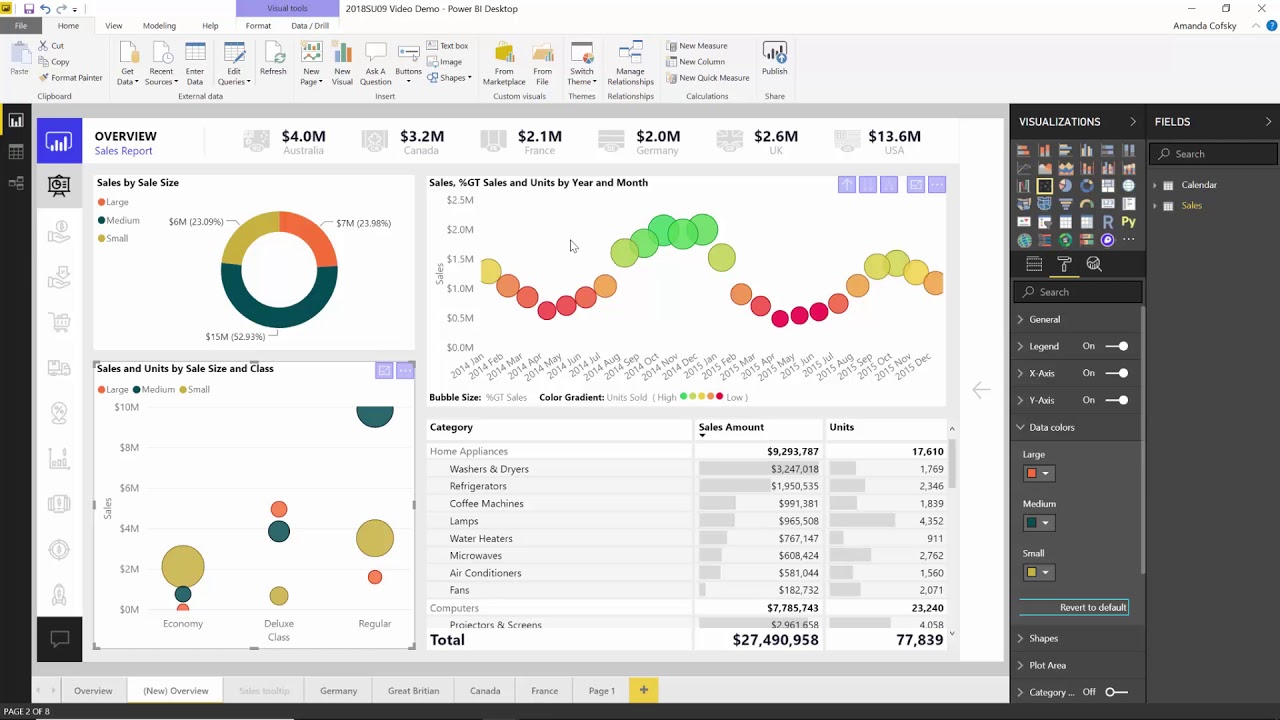
Among the most interesting points here is clearly the
“Aggregation”
function, which makes it possible to load aggregated data without having to load the entire data set first.
This significantly speeds up the overall user experience by increasing search speed, which is especially noticeable when refreshing data.
If you want to call up more detailed information, this is done completely unobtrusively in the background.
The setup of this method also looks simple and can now be tested as a preview for now, but it will also be released soon.
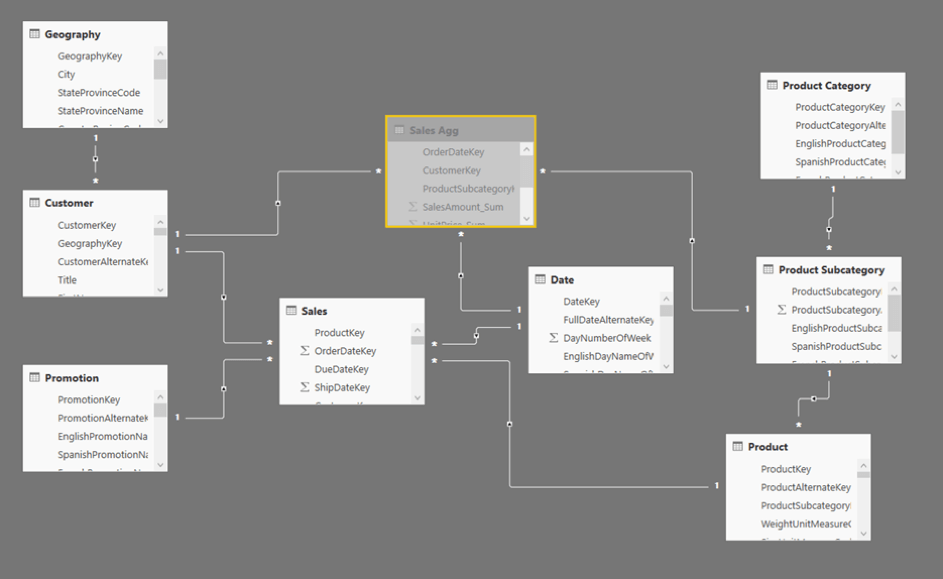
Figure 1 – Aggregation function
PDF file connector
A feature often requested by the community is the
“PDF file connector”
which is now also available for testing.
Through this, the user can easily extract tables from PDF files and make a selection of the included tables to use the tables in Power BI.
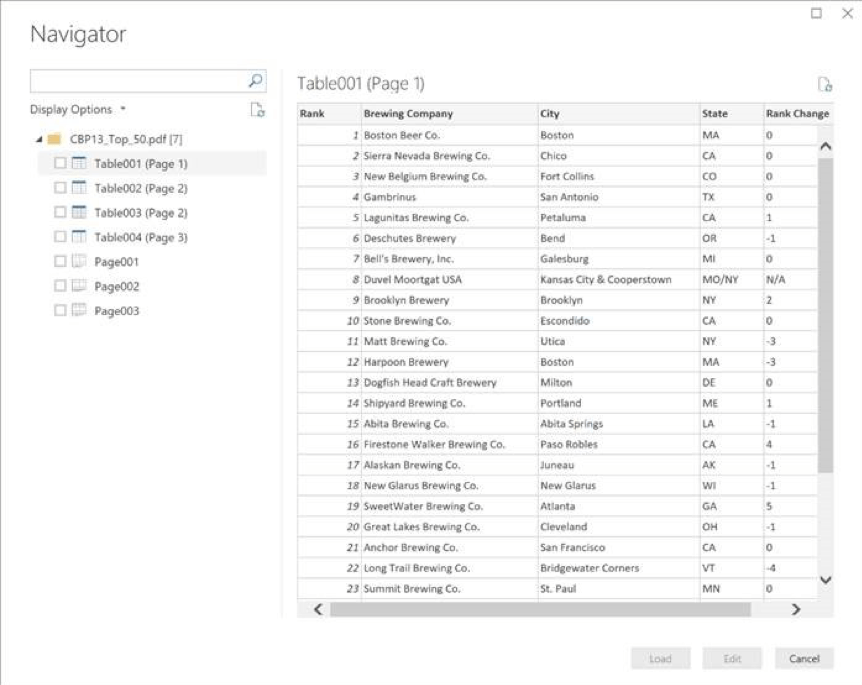
Figure 2 – The data connection to a PDF file
In the individual areas there are additionally many smaller renewals, which facilitate the work or extend the visualization possibilities.
“Dot plot” effects in reporting
In reporting, it is now possible, for example, to add date or text fields to the x-axis at
“Dot plot” effects
with date or text fields or to change the user interface with predefined themes. The goal here is to encourage the involvement of the community and the development and exchange of own themes, which can be shared among each other in the community area.
Text Enhancer
For formatting, new functions have been added in many places, so that, for example, you can use the new format. through which
“Text Enhancer”
(MAQ Software) provides completely new possibilities to dynamically adjust text fields or add different effects to texts.
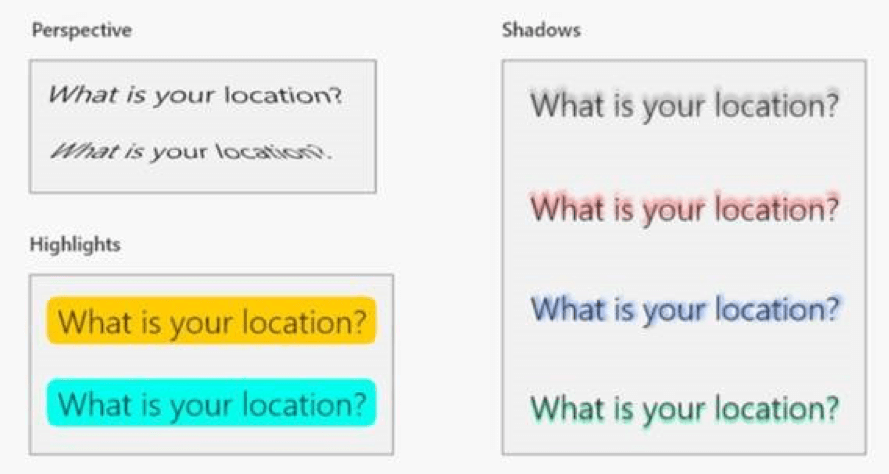
Figure 4 – Formatting options through Text Enhancer
Horizon Chart & Multi KPI
Graphically very appealing are also the new
“Horizon Chart”
with the overlapping horizons and the
“Multi KPI”
which changes related KPIs at the same time when interacting with them.
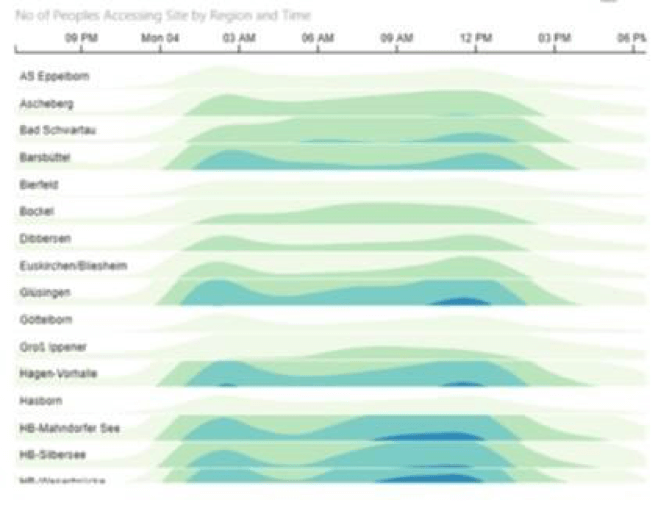
Figure 4 – Horizon Chart
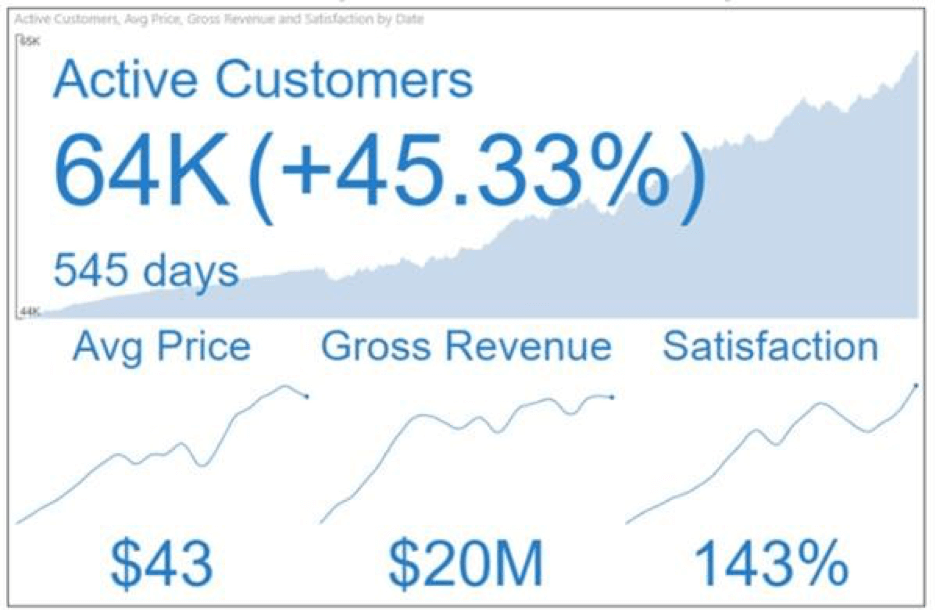
Figure 5 – Multi KPI
Furthermore, tooltips are now available everywhere and no longer have to be activated via the options.
After all these visual enhancements, the developers were also considered. Firstly, it is now possible to edit the editing and analysis area by keyboard input. In my opinion, a very nice extension to be able to modify content faster. On the other hand the
“Advanced Editor”
now added an Intellisense that can visually highlight components and make suggestions.
It is likely that this will be further expanded and integrated into other areas.
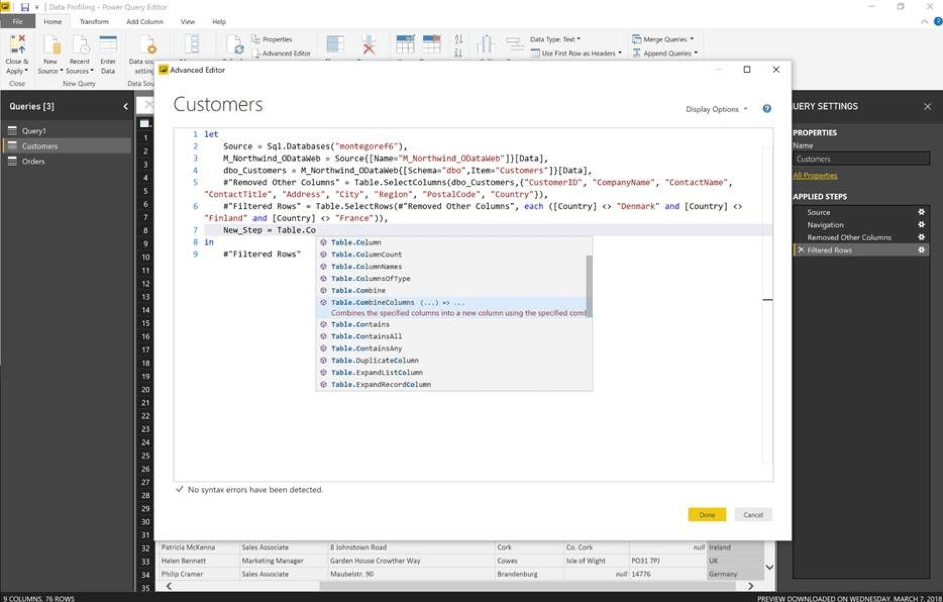
Figure 6 – Intellisense in the Advanced Editor
More details about the innovations
Details about the Power BI innovations in the September 2018 update can be found in the following video.
Mit dem Laden des Videos akzeptieren Sie die Datenschutzerklärung von YouTube.
Mehr erfahren
I am curious to see what will be implemented next month.
Your Tobias Wirths
If you would like to learn more about the possible uses of Microsoft Power BI or need a partner for the implementation, please contact us!